
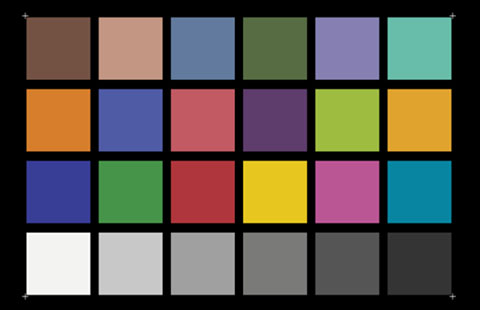
The YE0188 was designed with respect of the well- known 'ColorChecker'. Used in photography, film and TV, the chart consists of 18 color patches and a 6-step gray scale.
Using the ColorChecker color rendition chart
The ultimate goal of any process of photography, electronic publishing, printing, or television is to reproduce all colors perfectly. However, color rendition is a very subjective matter.
To help make meaningful judgments about color rendition, a totally non-subjective standard of comparison is needed. The ColorChecker chart provides the needed standard with which to compare, measure and analyze differences in color reproduction in various processes.
The ColorChecker is a checkerboard array of 24 scientifically prepared colored squares in a wide range of colors. Many of these squares represent natural objects of special interest, such as human skin, foliage and blue sky. These squares are not only the same color as their counterparts, but also reflect light the same way in all parts of the visible spectrum. Because of this unique feature, the squares will match the colors of natural objects under any illumination and with any color reproduction process.
The ColorChecker chart provides an easy way to recognize and evaluate the many factors that can affect color reproduction. To evaluate the effect of varying any given factor, simply compare the chart´s color image as it appears on the photograph, television picture, computer monitor, or printed sample - with the actual ColorChecker. This comparison may be made visually or through optical density measurements.
The ColorChecker is proportioned so individual squares are large enough to be measured with a densitometer. Many variables may influence the kind of light reflected by the ColorChecker. These include the spectral nature of the light sources and of nearby objects that may reflect light toward the chart or otherwise affect the illumination. Also, camera lenses may be slightly colored, or may gather stray light from outside the ColorChecker. The type of film, equipment, processing, and (in graphic arts reproduction) printing ink may likewise affect color rendition. Even the very appearance of the ColorChecker and its imaged copy may be influenced by viewing conditions.
We mention these variables so that when you use the ColorChecker, you will be aware of them and take steps to control them. In this way, you will be able to know which differences in color rendition can be ascribed to which parts of your system. Clearly, you may need to make a number of controlled test to account for the unintentional variations in process.
Suggested Applications
Photography
1. Photograph the ColorChecker chart using color print film under two different types of illumination to produce color prints. Compare the images (or the measured reflection densities of corresponding areas on the prints) to evaluate the effect of changing illumination. Repeat the process using various filters.
2. Do the same as in # 1 above, but use two different types of transparency film. Compare the slides visually or use a densitometer to compare the transmission densities of corresponding areas.
3. Photograph the ColorChecker chart using two different types of color film. Then compare the slides or prints to the ColorChecker. For critical comparison, standardized lighting, as found in X-Rite lighting products, should be used. Slides should be viewed on a standard transparency viewer and prints should be illuminated by a 5000K light source. The slides and prints can also be compared by using a densitometer.
Graphic Arts
1. Make color separations and plates of the ColorChecker chart. Print ink-on-paper copy of the ColorChecker chart. Compare the copy to the original chart under standard viewing conditions, or compare the measured reflection densities using a densitometer.
2. With this information, you can now make the necessary adjustments for your color separation and/ or printing process.
Electronic Publishing
1. Make a scan of the ColorChecker using the default settings of your scanning software. Open scanned image in your image editing or scan utility software, then measure and record the RGB values for each patch in the ColorChecker image.
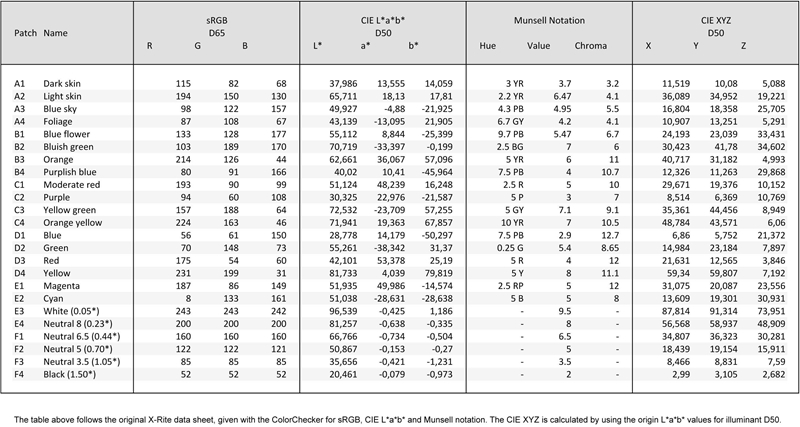
2. Compare these readings with those from a “pure” digital TIFF file of the ColorChecker or from the table below. Calculate and record the differences.
3. With this information, you can create a characterization profile in either your image editing software or scan utility software. This can be used to adjust all future scans to compensate for the characteristics of your scanner.
Television
1. Frame the ColorChecker chart with a video camera and adjust several control monitors to display the chart identically.
2. View the ColorChecker chart with several video cameras (making sure the lighting is always the same). Display the pictures on the balanced monitors and adjust the cameras to make all of the monitors match as closely as possible. The residual differences in color rendition will be displayed on the monitors.
Technical Data
Color names and specifications are given in the table below. The Munsell notations (which describe color in terms of hue, value, and chroma) are widely used by artists, designers and color technologists. The ISCC-NBS names are designated by a method established by the Inter-Society Color Council and the National Bureau of Standards of the USA. The assigned names are either names of natural objects spectrally simulated, names of additive primaries (red, green, and blue) and subtractive primaries (cyan, magenta, and yellow), Munsell names (for the gray series), or abbreviated ISCC-NBS names. A more in-depth technical description of the chart can be found in the article “A Color Rendition Chart” by C. S. McCamy, H. Marcus and J. G. Davidson, Journal of Applied Photographic Engineering, Summer Issue 1976, Vol. 2, No. 3, pg. 95-99.
Note: The user should be careful to avoid touching the colored squares of the ColorChecker chart with fingers or objects that might mar or soil the colors. Avoid exposing the ColorChecker chart to light, except when it is in use. Also avoid exposing it to high temperature, high humidity and chemical fumes. Depending on use, it is recommended that you replace your ColorChecker chart every two years to ensure correct color identification.
1. When I received NH310/NH300 colorimeter and perform measurement, why the measured data is abnormal?
After receiving NH310/NH300, you have to perform white and black calibration manually when first starting.
2. In which condition, manual white and black calibration and auto calibration are required for NH310?
a. It’s needed to perform manual calibration for NH310 when first starting.
b. In the subsequent starting, NH310 will perform auto calibration at startup. No need to perform manual calibration.
c. Suggestion: it’s best to perform manual calibration once a week or when NH310 measured data is not accurate.
3. In which condition, manual white and black calibration for NH300 is required?
a. It’s needed to perform manual calibration for NH300 when first starting.
b. In the subsequent starting, no need to perform manual calibration.
c. Suggestion: it’s best to perform manual calibration once a week or when NH300 measured data is not accurate.
4. How to replace NH310 measuring aperture?
There are three measuring apertures for NH310: Φ8mm (standard accessory), Φ4mm (standard accessory), extended Φ8mm (optional accessory)
a. Turning on
b. Removing measuring aperture, install the needed measuring aperture.
c. Select “Settings-Aperture Setting” in main menu to select corresponding measuring aperture.
d. After selecting aperture, the instrument will display “White and Black Calibration” interface. White and black calibration must be performed.
e. Replace completed.
5. CQCS3 (Color Quality Control System) Installation
a. Before installation, please Copy CQCS3 folder to your computer and don’t remove any files in CQCS3 folder.
b. Double-click the setup.exe to install CQCS3 software.
c. Then double-click Install.bat under the CQCS3\USB_Driver file to install the driver.
d. Detailed installation information please read the "Installing Software" under CQCS3 User manual.doc.
6. How to check communication port?
a. Connect colorimeter to the PC with USB cable.
b. Turn on the colorimeter to enter main menu. Select “Comm” and press “Enter” key to start communication.
c. Right click on “My Computer” on the desktop. Click “Manage” -> “Device Manager” -> “Ports”, you can see similar display as “SCI USB2Serial (COM6)”.
d. Click “Settings->Communication Parameters” in CQCS3 software interface. Select the corresponding port in “Serial Port”.
7. After completing CQCS3 installation, how to solve the problem if it display “! USB Device” or “! SCI USB2Serial (COM6)” when checking the communication port?
a. Right click “! USB Device” or “! SCI USB2Serial (COM6)”, “Update Driver” -> “Install from a list or specific location (Advanced)” -> “Next” ->“Include this location in the search” -> “Browse”, specify USB driver file path “CQCS3\USB_Driver”, click “Next”. Then it will install successfully.
b.Detailed installation information please refers to “2.2 Installing USB Driver” in Color Quality Management System User Manual.doc.
8. Notes for First Using CQCS3 Software
a. Users must specify Standard File Name, Sample File Name and Sample Database File Name when first use.
b.Standard File is use to store standard measurement data. Sample File is used to store sample measurement data. Sample Database File is used to store the measured data exported from sample records.
9. How to solve the problem when “Connection Timeout” occurred?
a. When the colorimeter is disconnected to the PC, “Connection Timeout” will occur. At the moment, you have to check whether the USB cable is well connected the colorimeter and the PC. Then you can re-plug the USB to try out.
b. After ensuring the colorimeter is connected to the PC with USB cable, turn on the colorimeter and enter the main menu. Select “Comm” and press “Enter” key to start communication.
c. Turn off CQCS3 software, and reopen it.
10. How to solve the problem when the interface display "USB Disconnect"
a. Check whether the USB cable is connected. If not, please connect it. Check whether the connection is effective. You can re-plug the USB cable to test.
b. If the USB cable is connected well but the interface still displays "USB Disconnect", please re-start the colorimeter and enter "Menu" -"Comm"to start the communication.
c. Change the USB cable or change the USB port in you PC.
11. How to solve the problem when the colorimeter cannot be turned on in the condition of battery-powered?
a. If this phenomenon occurred, it means the battery power is not enough. You need to charge the battery.
b. When charge the battery, please insert the battery to the instrument, and plug in the adapter to charge the battery. After 5 minutes, the instrument can be turned on.
c. If the instrument still cannot be turned on after charging 5 minutes, you can pull out the adapter and re-plug in to check it. Or repeat this operation.
d. If the instrument still cannot be turned on after charging 5 minutes, you can turn off the colorimeter and turn on it again to check it. Or repeat this operation.
e. If you have tried all the methods above but the colorimeter still cannot be turned on, please change the battery.
