
SineImage ISO 12233:2014 E-SFR charts are implementations of the Low Contrast Edge SFR (E-SFR) test chart illustrated in Section 6.1 and Annex Cof the ISO Standard Document. The charts come in three versions:
We currently offer these charts in inkjet format, with Enhanced versionsavailable as photographic prints. All SineImage ISO 12233:2014 E-SFR charts are fully compliant with the ISO standard. The Imatest eSFR ISO moduleprovides highly automated support for the new charts.
| Chart Size | Standard | Enhanced | Extended |
|---|---|---|---|
| 1x |
200 mm × 305 mm 7.875" × 12" |
200 mm × 305 mm 7.875" × 12" |
200 mm × 365 mm 7.875" × 14.5" |
| 2x |
400 mm × 610 mm 15.75" × 24" |
400 mm × 610 mm 15.75" × 24" |
400 mm × 730 mm 15.75" × 29" |
| 4x |
800 mm × 1220 mm 31.5" × 48" |
800 mm × 1220 mm 31.5" × 48" |
800 mm × 1460 mm 31.5" × 58" |
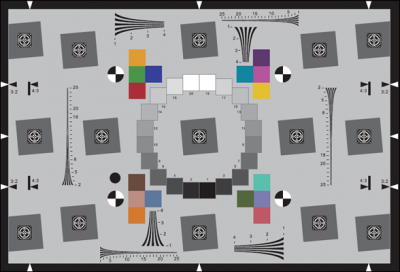
This chart, which has a 3:2 aspect ratio, is a "no-frills" implementation of the standard. For most work we recommend the Enhanced or Extended charts, which have additional edges for measuring performance near the image boundaries, as well as hyperbolic wedges and color patches (where the technology allows). These chartsmaintain full compliance with the standard.
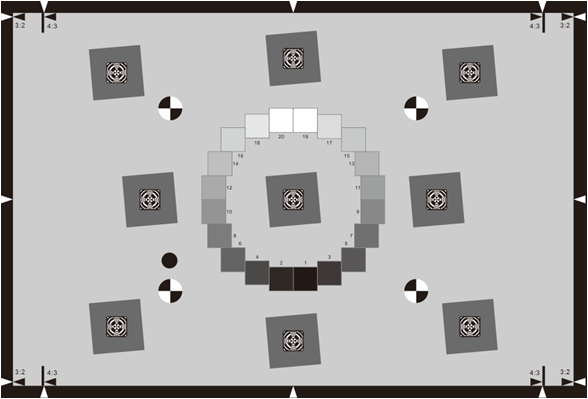
The Imatest Standard ISO 12233:2014 E-SFR chart closely resembles the Low contrast E-SFR test chart illustrated in section 6.1 and Annex C of the ISO standard document, with a few differences, all of which are fully compliant with the ISO standard.
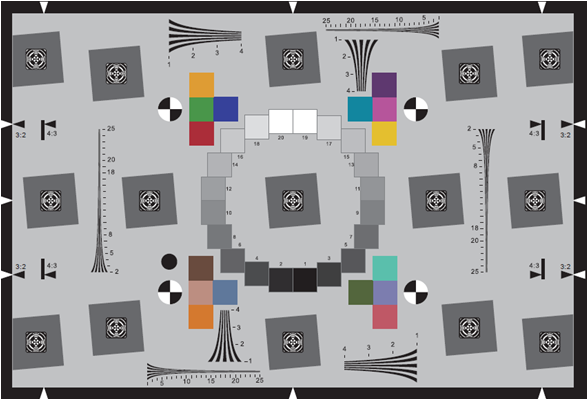
The Imatest Enhanced ISO 12233:2014 E-SFR chart has all the features of the Standard chart, keeping the 3:2 aspect ratio, with the addition of six added slanted squaresfor measuring performance near the image boundaries and hyperbolic wedges for visual analysis or analysis with the Imatest Wedge module. It also has 16 color patches when produced with technologies that allow color. Since these additions are in regions of the chart not covered by the standard, compliance with the standard is unaffected.
The differences between the Imatest charts and the chart illustrated in the standard are listed below. Even with these differences the Imatest chart is in full compliance with the standard.
The differences between the Enhanced and Standard Versions are as follows:
This chart will work with the fully-automated eSFR ISO module.
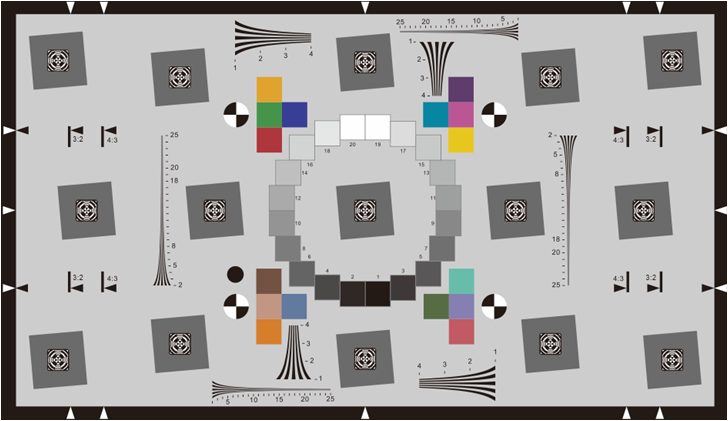
The Imatest Extended ISO 12233:2014 E-SFR chart has all the features of the Enhanced chart (six extra squares, wedges, and 16 color patches where possible), but has a16:9 aspect ratio, which makes it suitable for HDTV and cinema measurements (and it also works well with 3:2 aspect ratio DSLRs). It is fully compliant with the standard.
This chart will work with the fully-automated eSFR ISO module.
1. When I received NH310/NH300 colorimeter and perform measurement, why the measured data is abnormal?
After receiving NH310/NH300, you have to perform white and black calibration manually when first starting.
2. In which condition, manual white and black calibration and auto calibration are required for NH310?
a. It’s needed to perform manual calibration for NH310 when first starting.
b. In the subsequent starting, NH310 will perform auto calibration at startup. No need to perform manual calibration.
c. Suggestion: it’s best to perform manual calibration once a week or when NH310 measured data is not accurate.
3. In which condition, manual white and black calibration for NH300 is required?
a. It’s needed to perform manual calibration for NH300 when first starting.
b. In the subsequent starting, no need to perform manual calibration.
c. Suggestion: it’s best to perform manual calibration once a week or when NH300 measured data is not accurate.
4. How to replace NH310 measuring aperture?
There are three measuring apertures for NH310: Φ8mm (standard accessory), Φ4mm (standard accessory), extended Φ8mm (optional accessory)
a. Turning on
b. Removing measuring aperture, install the needed measuring aperture.
c. Select “Settings-Aperture Setting” in main menu to select corresponding measuring aperture.
d. After selecting aperture, the instrument will display “White and Black Calibration” interface. White and black calibration must be performed.
e. Replace completed.
5. CQCS3 (Color Quality Control System) Installation
a. Before installation, please Copy CQCS3 folder to your computer and don’t remove any files in CQCS3 folder.
b. Double-click the setup.exe to install CQCS3 software.
c. Then double-click Install.bat under the CQCS3\USB_Driver file to install the driver.
d. Detailed installation information please read the "Installing Software" under CQCS3 User manual.doc.
6. How to check communication port?
a. Connect colorimeter to the PC with USB cable.
b. Turn on the colorimeter to enter main menu. Select “Comm” and press “Enter” key to start communication.
c. Right click on “My Computer” on the desktop. Click “Manage” -> “Device Manager” -> “Ports”, you can see similar display as “SCI USB2Serial (COM6)”.
d. Click “Settings->Communication Parameters” in CQCS3 software interface. Select the corresponding port in “Serial Port”.
7. After completing CQCS3 installation, how to solve the problem if it display “! USB Device” or “! SCI USB2Serial (COM6)” when checking the communication port?
a. Right click “! USB Device” or “! SCI USB2Serial (COM6)”, “Update Driver” -> “Install from a list or specific location (Advanced)” -> “Next” ->“Include this location in the search” -> “Browse”, specify USB driver file path “CQCS3\USB_Driver”, click “Next”. Then it will install successfully.
b.Detailed installation information please refers to “2.2 Installing USB Driver” in Color Quality Management System User Manual.doc.
8. Notes for First Using CQCS3 Software
a. Users must specify Standard File Name, Sample File Name and Sample Database File Name when first use.
b.Standard File is use to store standard measurement data. Sample File is used to store sample measurement data. Sample Database File is used to store the measured data exported from sample records.
9. How to solve the problem when “Connection Timeout” occurred?
a. When the colorimeter is disconnected to the PC, “Connection Timeout” will occur. At the moment, you have to check whether the USB cable is well connected the colorimeter and the PC. Then you can re-plug the USB to try out.
b. After ensuring the colorimeter is connected to the PC with USB cable, turn on the colorimeter and enter the main menu. Select “Comm” and press “Enter” key to start communication.
c. Turn off CQCS3 software, and reopen it.
10. How to solve the problem when the interface display "USB Disconnect"
a. Check whether the USB cable is connected. If not, please connect it. Check whether the connection is effective. You can re-plug the USB cable to test.
b. If the USB cable is connected well but the interface still displays "USB Disconnect", please re-start the colorimeter and enter "Menu" -"Comm"to start the communication.
c. Change the USB cable or change the USB port in you PC.
11. How to solve the problem when the colorimeter cannot be turned on in the condition of battery-powered?
a. If this phenomenon occurred, it means the battery power is not enough. You need to charge the battery.
b. When charge the battery, please insert the battery to the instrument, and plug in the adapter to charge the battery. After 5 minutes, the instrument can be turned on.
c. If the instrument still cannot be turned on after charging 5 minutes, you can pull out the adapter and re-plug in to check it. Or repeat this operation.
d. If the instrument still cannot be turned on after charging 5 minutes, you can turn off the colorimeter and turn on it again to check it. Or repeat this operation.
e. If you have tried all the methods above but the colorimeter still cannot be turned on, please change the battery.
